
Part 3 - Size Is Not Speed:
Why BPW Fails to Rank Similar-Sized Quants
The KLD story has a speed-side twin. Bits per weight (BPW) looks like it should predict token generation rate: fewer bits means fewer bytes to move for every generated token, which is the basic performance argument for low-bit quantization.
Across quants that differ substantially in size, that intuition often holds. But users are usually choosing among models that already fit and fall within a relatively narrow size range. Does BPW still rank their speed?
We test this using the same 28 Qwen3.6-35B-A3B quants across ten devices. Six devices cover most or all of the cohort, while four provide partial coverage because they could run only 9–11 quants.
TL;DR
- Across broad BPW ranges, smaller quants often generate tokens faster. The relationship is strongest on the CPUs we tested, although it varies by device and disappears entirely on the RTX 3090.
- Among similarly sized quants, BPW provides little or no speed-ranking signal. A slightly lower-BPW quant is about as likely to be slower as faster across the broadly tested devices.
- Hardware and quantization format determine the local ordering. Kernel support, datatype implementation, and device architecture can make a slightly larger quant faster than a smaller one.
- BPW is useful for estimating weight storage and screening broadly different options, not for predicting realized speed. Once the viable models are similar in size, compare measured token-generation throughput on the target hardware.
- Use size to determine what fits; use benchmarks to measure quality; and use real throughput measurements to rank speed.
1 - Headline correlation
Across quants that differ substantially in size, lower BPW generally predicts higher token-generation throughput. The figure below shows BPW versus tokens per second across the tested quants and devices.
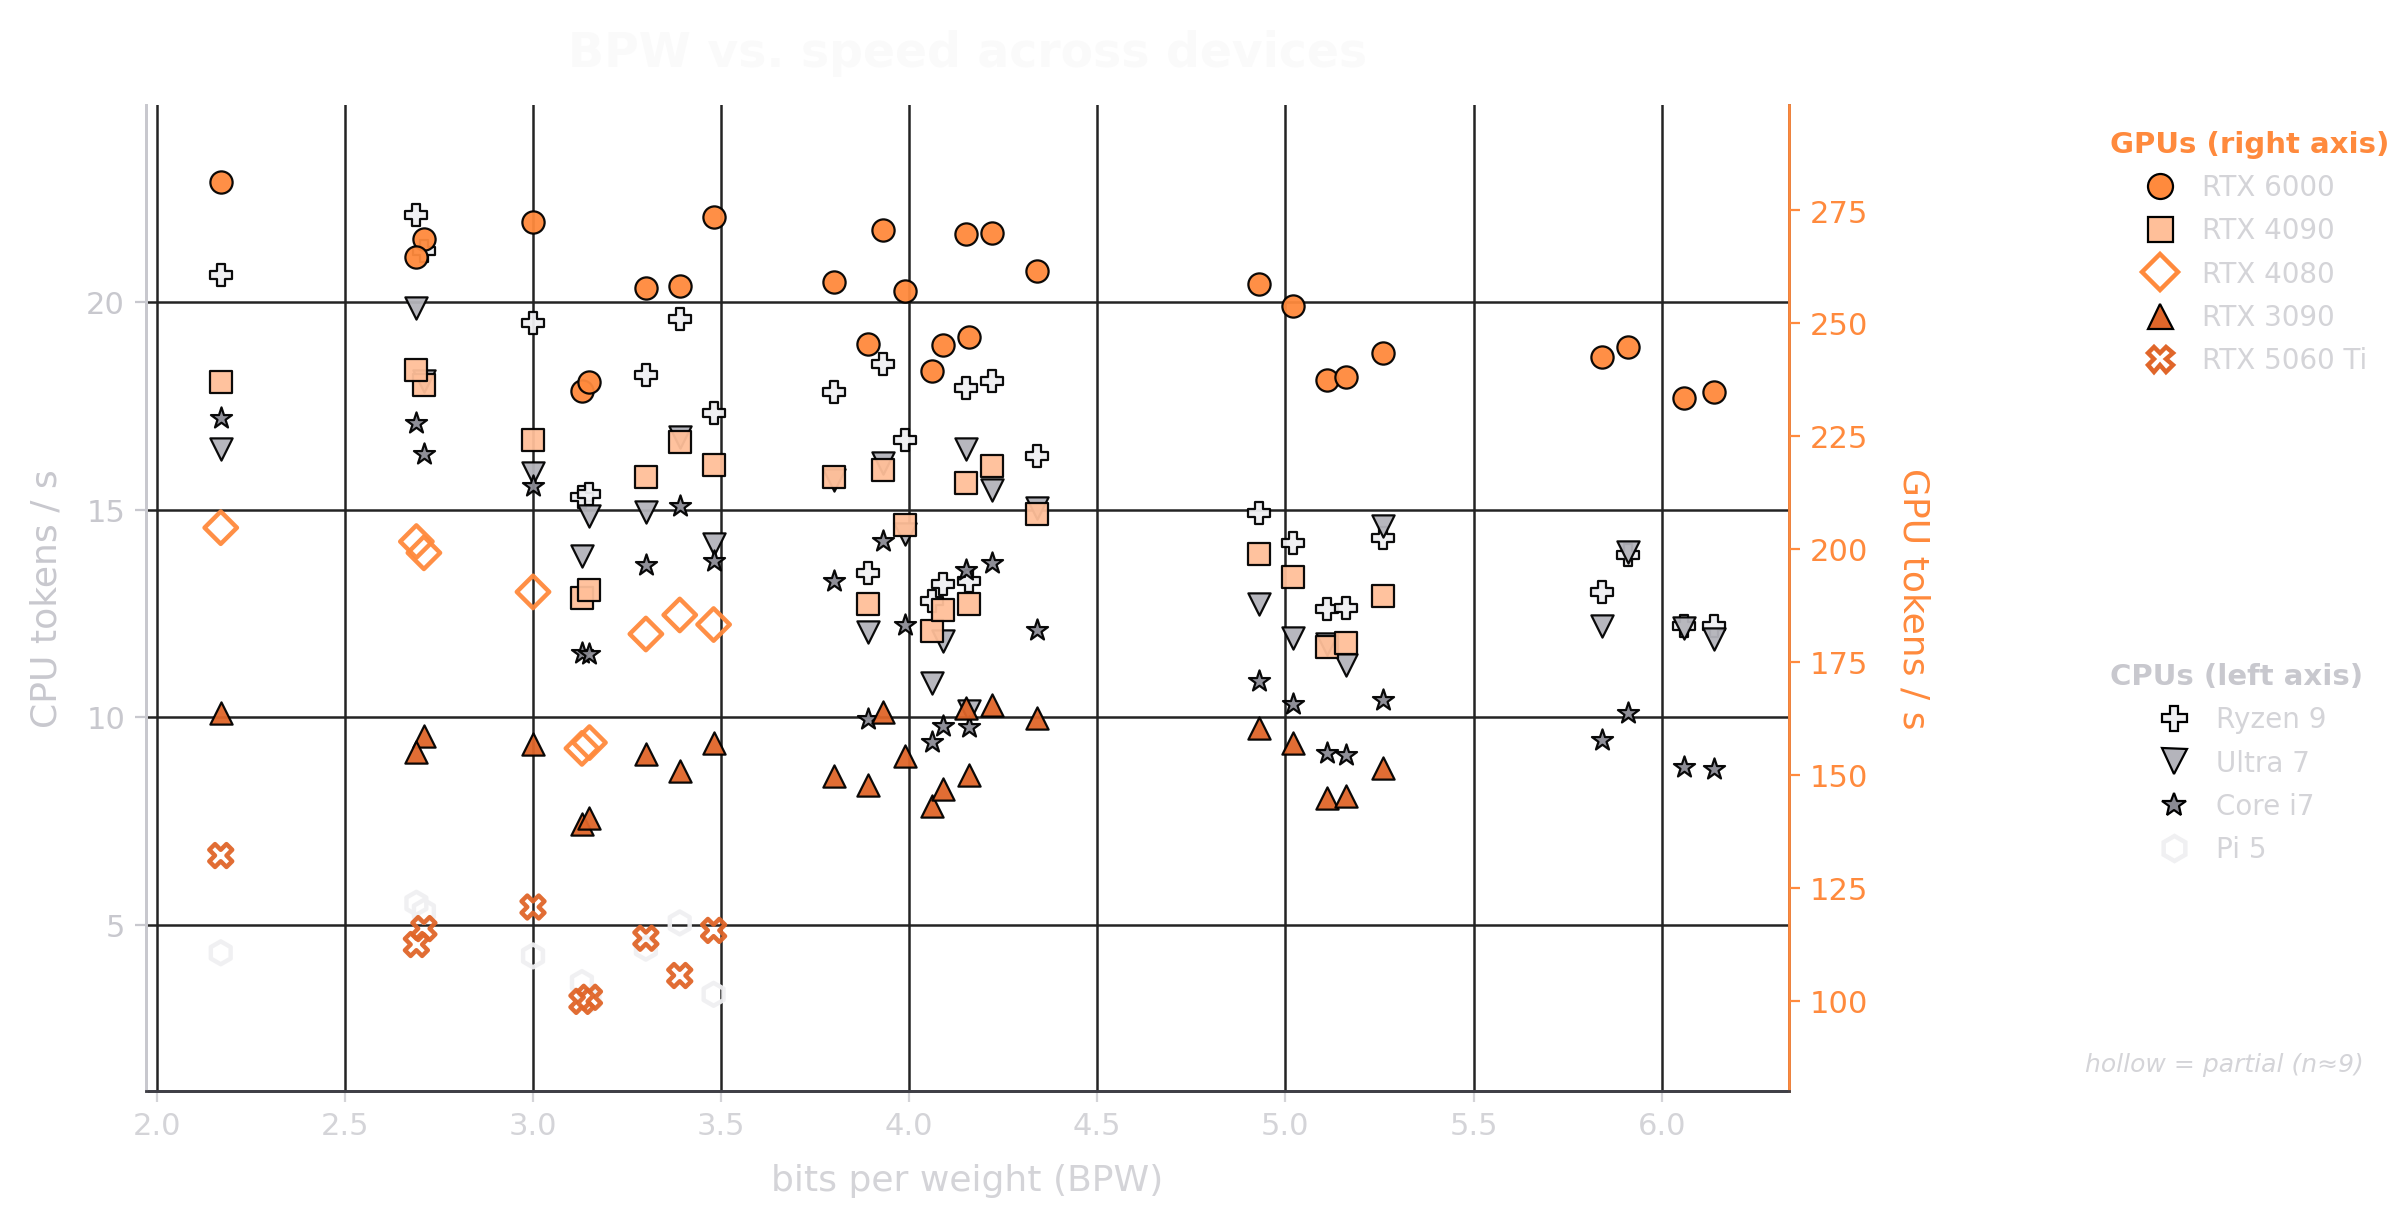
We summarize the full-range relationship using Spearman correlation between BPW and token-generation rate:
| Device | Class | n | ρ(BPW, TPS) | p |
|---|---|---|---|---|
| Core i7 | CPU | 28 | −0.79 | <0.001 |
| Ryzen 9 | CPU | 28 | −0.78 | <0.001 |
| Ultra 7 | CPU | 28 | −0.60 | 0.001 |
| Raspberry Pi 5 † | CPU | 9 | −0.42 | 0.27 |
| RTX 4080 † | GPU | 9 | −0.68 | 0.042 |
| RTX 4090 | GPU | 24 | −0.65 | 0.001 |
| RTX 6000 | GPU | 28 | −0.53 | 0.003 |
| RTX 5060 Ti † | GPU | 9 | −0.42 | 0.27 |
| RX 9060 XT † | GPU | 11 | −0.35 | 0.29 |
| RTX 3090 | GPU | 24 | −0.01 | 0.97 |
Five of the six devices with broad model coverage show a significant negative correlation: lower-BPW quants generally generate tokens faster. The relationship is strongest on the full-coverage CPUs, consistent with token generation being heavily constrained by weight memory traffic.
The four partial-coverage devices include only 9–11 quants, so their estimates are less precise. The major exception is the RTX 3090, where BPW has essentially no monotonic relationship with throughput: \(\rho=-0.01\).
These full-cohort correlations answer only a coarse question. They compare quants separated by several bits per weight. They do not tell us whether BPW can rank the similarly sized quants users are more likely to choose between.
2 - Local ranking
The deployment-relevant question is what happens locally. Once two quants fall within a similar BPW range, does the slightly smaller one still tend to run faster?
2.1 - Size-conditioned pairwise analysis
The most direct way to test this is to compare quants pairwise without imposing fixed BPW groups.
Method
For every pair of quants, we ask a simple question:
Does the lower-BPW quant run faster?
We include a pair only when the two quants differ by no more than a tolerance \(\varepsilon\):
\[|\mathrm{bpw}_i-\mathrm{bpw}_j| \leq \varepsilon\]
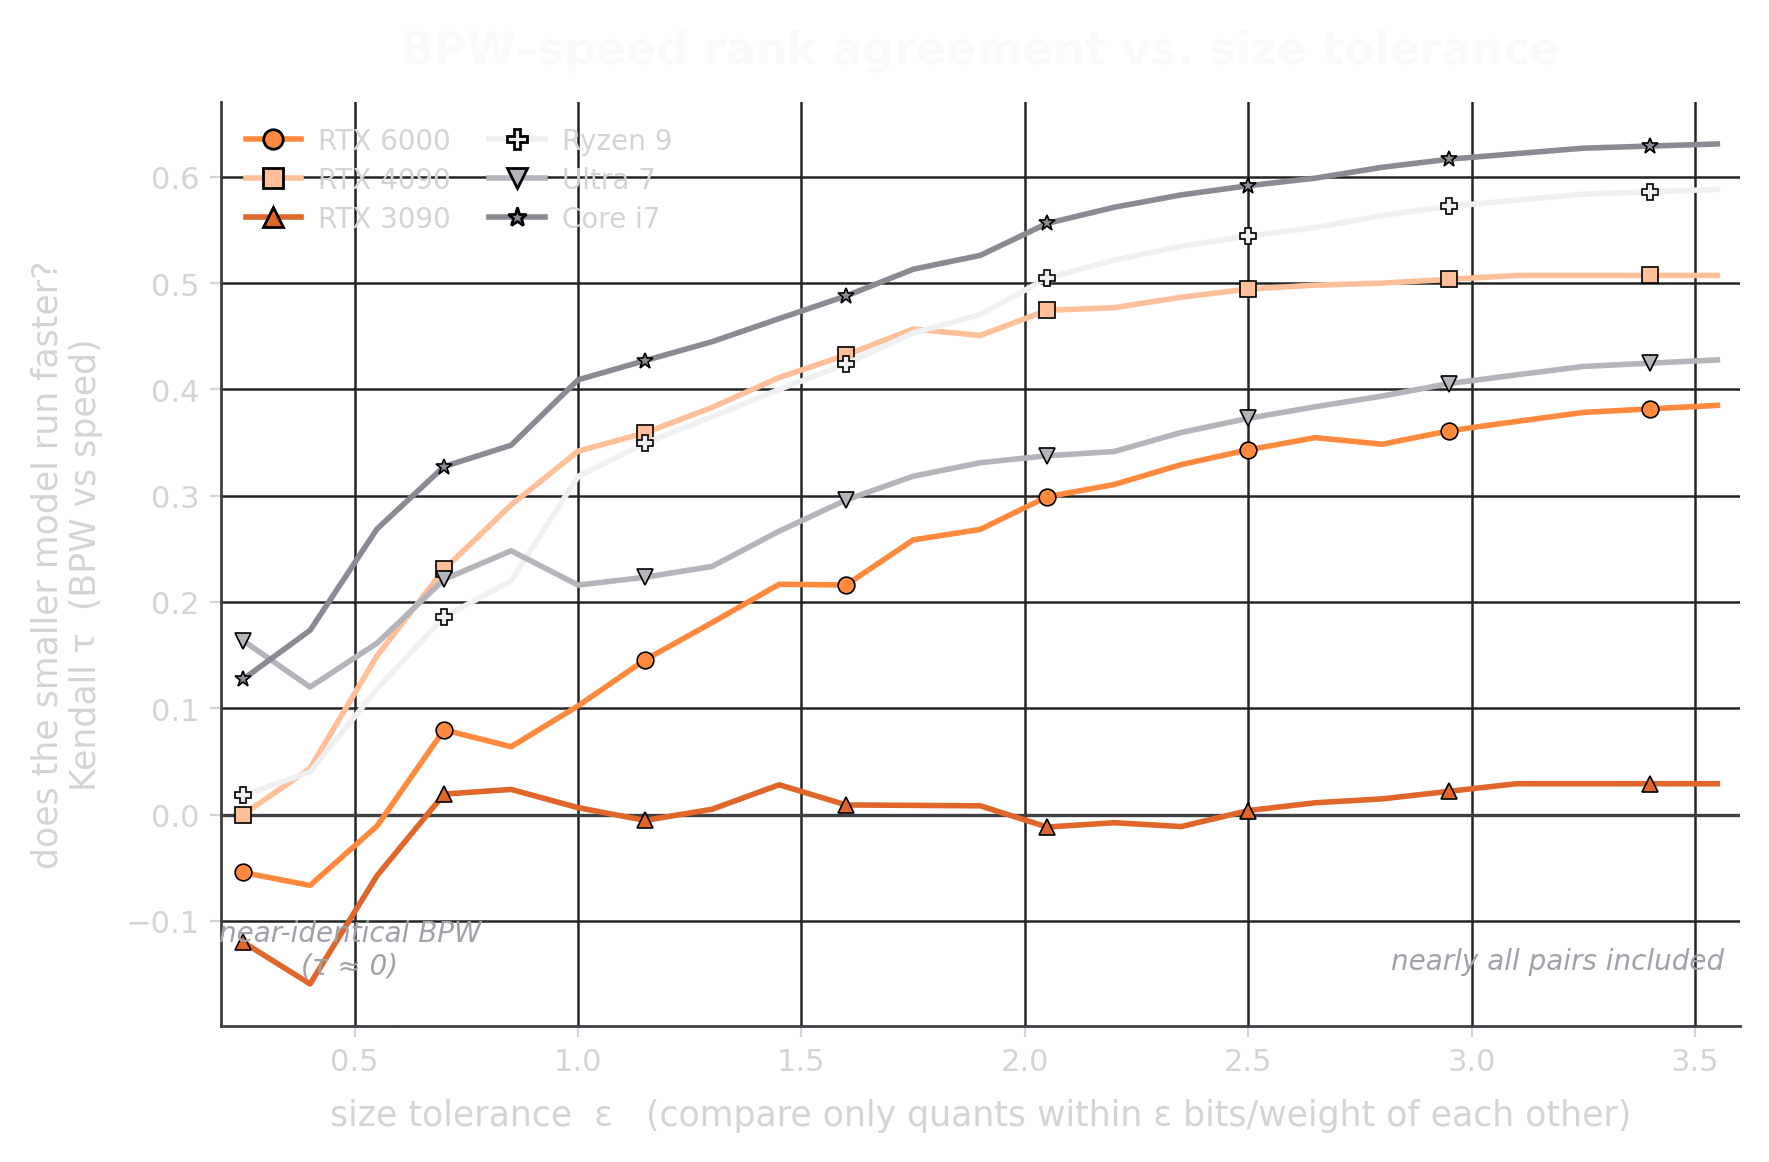
The resulting pairwise concordance score ranges from \(+1\), where the lower-BPW quant is always faster, through \(0\), where BPW provides no ordering signal, to \(-1\), where the lower-BPW quant is consistently slower.
At small \(\varepsilon\), only nearly equal-size quants are compared. As \(\varepsilon\) increases, progressively larger size differences are allowed, until nearly every pair in the cohort is included.
Results
At small tolerances, the scores for all six devices remain close to zero, ranging from approximately \(-0.12\) to \(+0.16\). Among similarly sized quants, lower BPW does not reliably imply higher throughput.
As the tolerance widens, five of the six curves rise smoothly toward approximately \(+0.4\) to \(+0.6\). BPW becomes informative only when the comparison includes quants separated by meaningfully different sizes.
The RTX 3090 is the exception. Its curve remains near zero across the full tolerance range, consistent with its full-cohort Spearman correlation of \(\rho=-0.01\).
The analysis separates two assumptions that are often treated as equivalent:
- Across substantially different sizes, lower BPW generally predicts higher throughput.
- Among similarly sized quants, lower BPW still reliably predicts higher throughput.
The first is broadly true. The second is not.
2.2 - Clustering as a visual check
The pairwise analysis avoids fixed BPW boundaries. As a visual cross-check, we also group the 28 quants into five BPW ranges using Fisher–Jenks natural breaks, selected without reference to throughput.
The figure below shows the six devices with the broadest model coverage. The gray bands mark the five BPW groups.
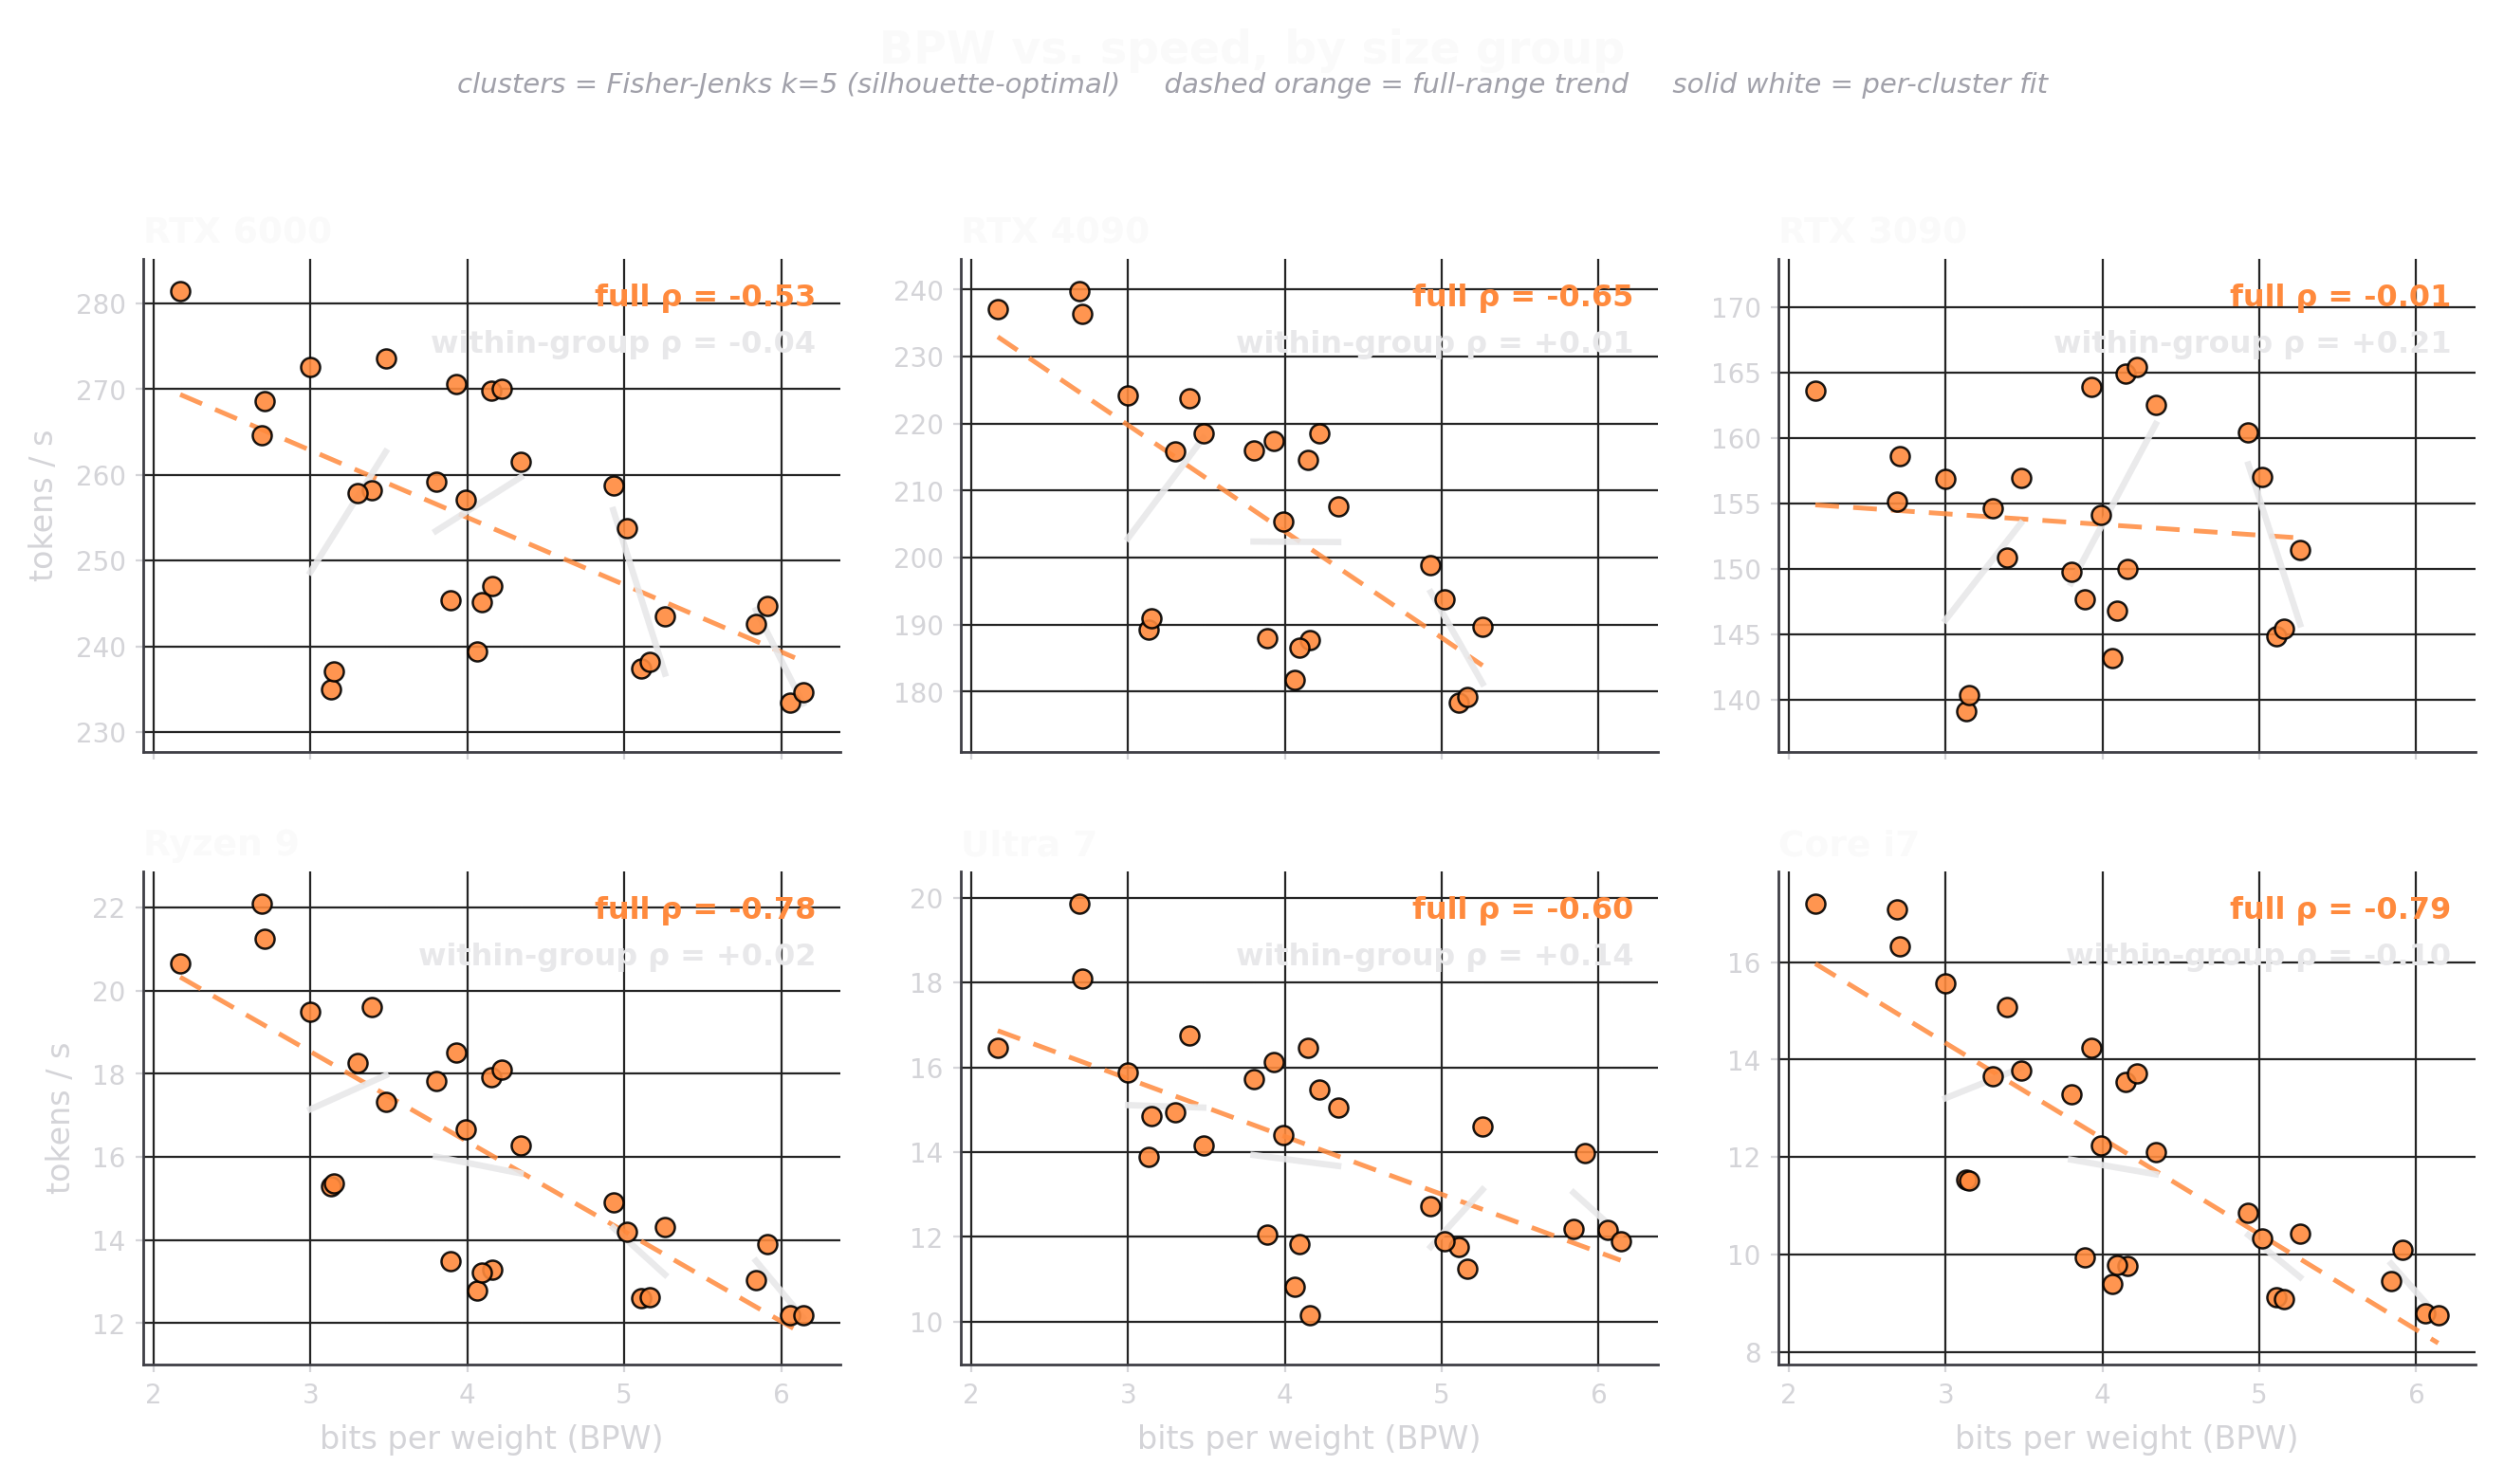
Within each group, the broad relationship between BPW and throughput largely disappears. Some local trends are flat, some are noisy, and some point in the opposite direction from the full-cohort relationship.
To quantify this, we remove the average BPW and throughput of each group, then compute a pooled Spearman correlation across the residuals. This measures whether lower BPW still predicts higher throughput after the broad differences between size groups have been removed.
| Device | Class | n | Full ρ | p | Within-group ρ | p |
|---|---|---|---|---|---|---|
| Core i7 | CPU | 28 | −0.79 | <0.001 | −0.10 | 0.60 |
| Ryzen 9 | CPU | 28 | −0.78 | <0.001 | +0.02 | 0.93 |
| RTX 4090 | GPU | 24 | −0.65 | 0.001 | +0.01 | 0.95 |
| Ultra 7 | CPU | 28 | −0.60 | 0.001 | +0.14 | 0.48 |
| RTX 6000 | GPU | 28 | −0.53 | 0.003 | −0.04 | 0.82 |
| RTX 3090 | GPU | 24 | −0.01 | 0.97 | +0.21 | 0.33 |
Five of the six devices show significant full-range correlations. Within the BPW groups, none of the coefficients is significant, and every coefficient is close to zero.
The same qualitative result holds under the alternative group counts we tested. A meaningful relationship reappears only when the groups become broad enough to include substantially different BPW ranges.
2.3 - Practical implication
Do not rank similarly sized quants by BPW alone. Within a narrow size range, the throughput ordering is largely determined by factors BPW does not encode, including quantization format, kernel support, and the target hardware.
To choose among similarly sized quants, measure actual token-generation throughput on the device where the model will run.
3 - Proxy rank is not deployment rank
The two halves of the series now align. KLD measures departure from the reference model but does not reliably rank near-baseline quality. BPW estimates weight storage and broad size differences but does not reliably rank similarly sized quants by token-generation throughput.
Both are useful screening metrics. Neither directly measures the deployment outcome.
The figure below compares where each quant is placed by the proxies with where it lands using measured deployment results on the RTX 6000. Each quant appears twice:
- a hollow circle at its proxy position, where lower KLD ranks higher on quality and lower BPW ranks higher on speed;
- an arrowhead at its measured deployment position, where composite benchmark score (from Part 2) determines quality rank and measured device token generation rate determines speed rank.
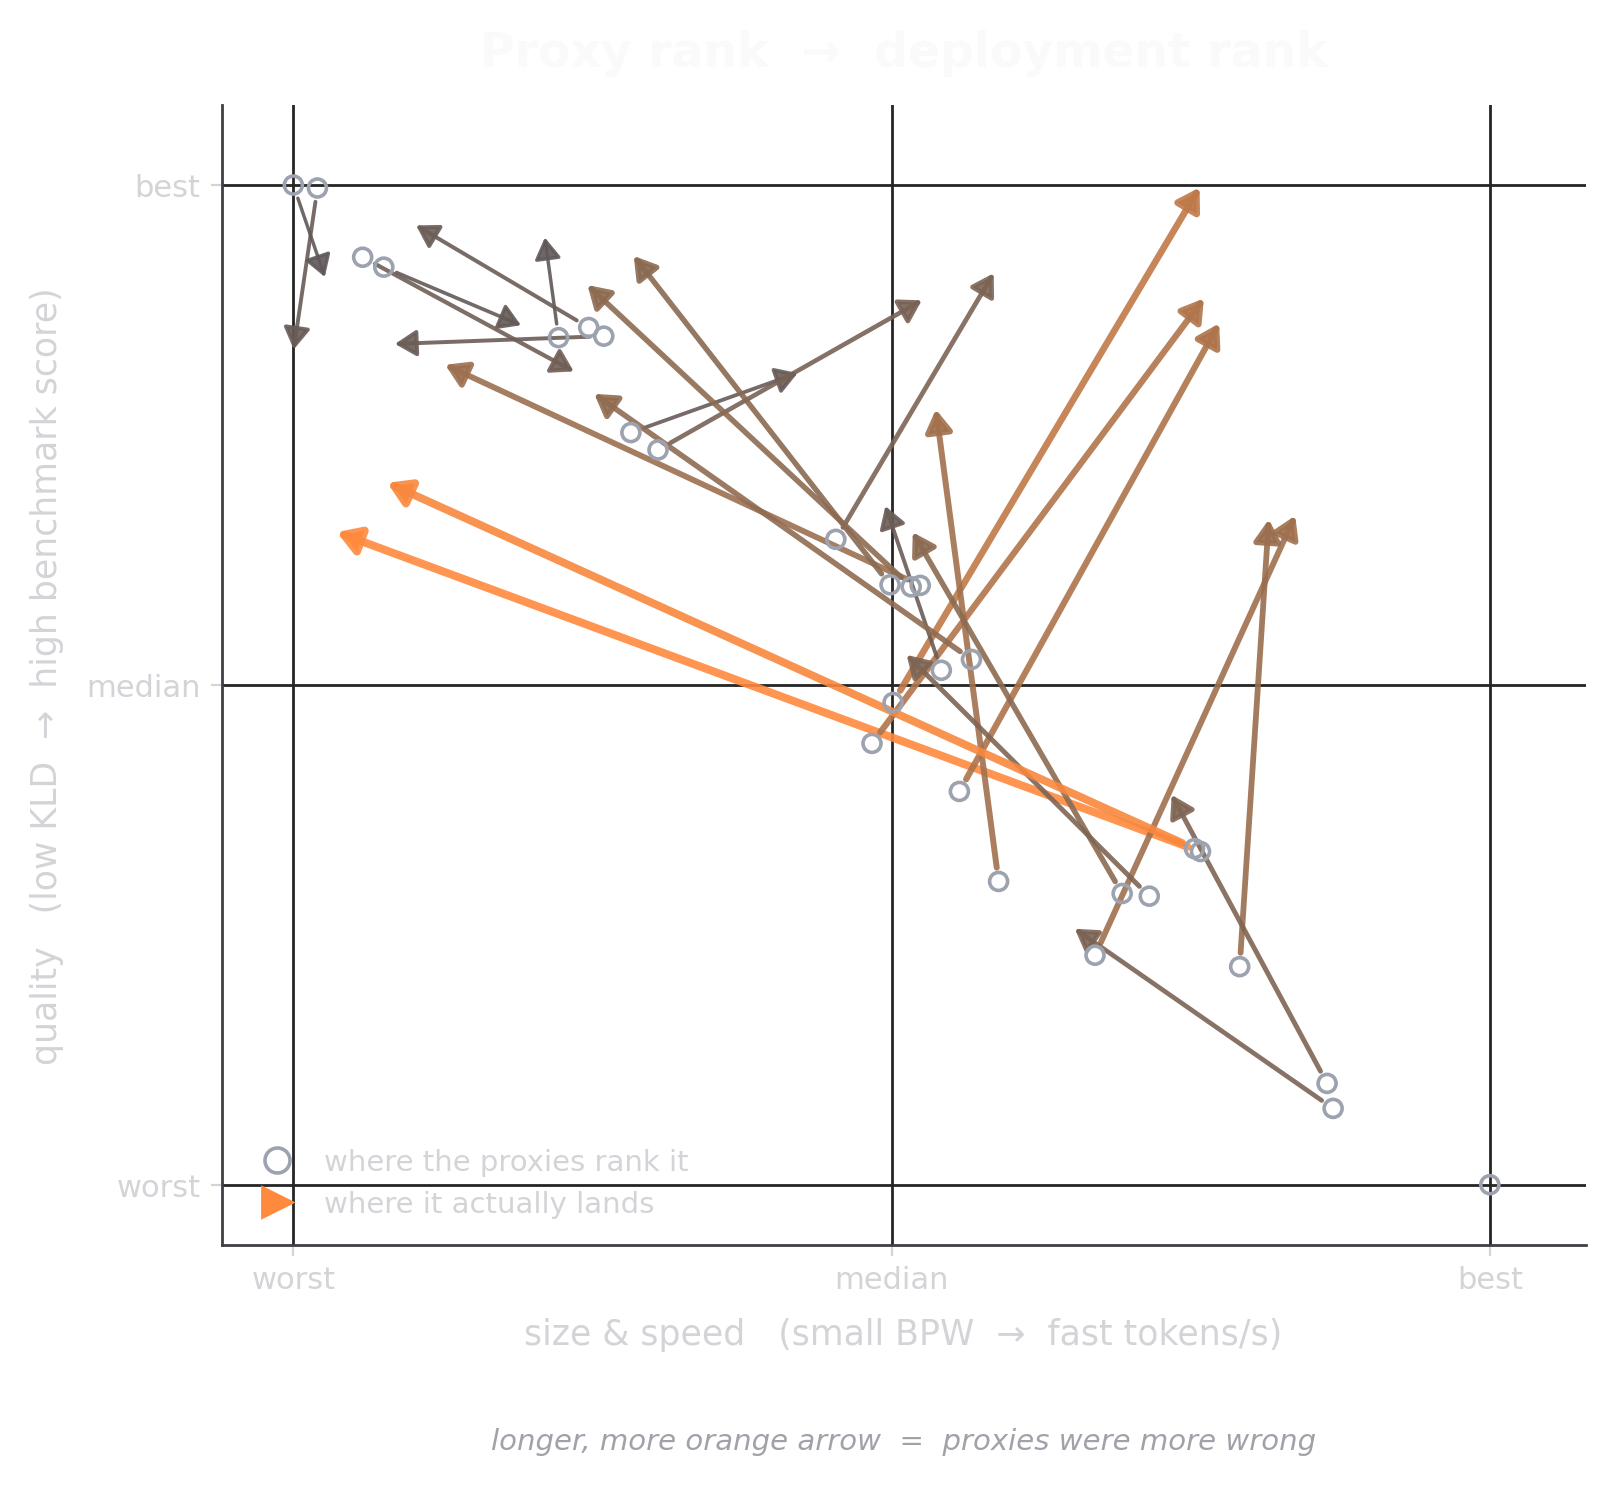
If the proxies reproduced the deployment ranking, the two positions would overlap. Instead, many quants move substantially, both vertically and horizontally. Vertical movement reflects disagreement between KLD rank and benchmark-quality rank. Horizontal movement reflects disagreement between BPW rank and measured-throughput rank.
The practical conclusion is simple: the quant that looks best by proxy is often not the quant that performs best in deployment.
To choose among viable models, measure the outcomes users actually care about: downstream quality and real token-generation throughput on the target hardware.
KLD measures displacement, not correctness. BPW approximates size, not realized speed.