
Part 2 - Displacement Is Not Direction:
Why Fidelity Metrics Fail to Rank Near-Baseline Quants
Part 1 argued that fidelity metrics measure similarity, not usefulness. Here we test that claim directly on real quantized models.
TL;DR
- Across the full cohort, perplexity and KLD appear to predict benchmark quality. That relationship is largely driven by clearly degraded models: as quantization becomes severe, fidelity worsens and benchmark scores fall.
- Among near-baseline quants, the general ranking signal disappears. Across 14 variants of perplexity, KLD, top-token agreement, context length, dataset, and response-only scoring, silent-zone correlations remain close to zero.
- KLD measures how much a quantized model differs from BF16, not what those differences mean. It strongly tracks the number of benchmark outcomes that change, but not whether those changes correct BF16’s mistakes or introduce new ones.
- The failure extends to the individual-prompt level. Lower per-prompt KLD does not reliably distinguish correct from incorrect responses, identify which model will answer a prompt correctly, or provide a useful routing signal.
- Some unsaturated math benchmarks retain a weak directional signal. Even there, KLD does not rank near-baseline quants reliably enough to replace the benchmark.
- Use fidelity metrics to detect substantial degradation. Use downstream benchmarks to rank deployable quants.
1 - Hard, cold data
Here we test whether perplexity and KLD can still serve as cheaper proxies for benchmark performance.
We treat downstream benchmark score as the primary quality signal. Benchmarks are slower and imperfect, but they directly test whether the model answers correctly, writes working code, or follows instructions.
Baseline perplexity and KL divergence
We begin with a standard llama.cpp-style evaluation: perplexity and KLD measured on WikiText-2 using 512-token chunks.
We then make the setup progressively more favorable to fidelity metrics by testing:
- longer context,
- data closer to deployment prompts,
- response-only scoring,
- alternative aggregation methods,
- and top-k KLD.
The question is whether any of these changes recover a useful ranking signal among near-baseline quants.
In the baseline setup, PPL measures the probability assigned to the observed next tokens, while KLD measures how much the quantized model’s full token distribution differs from BF16. Both are useful fidelity diagnostics, but neither directly tests downstream task performance.
Perplexity
The figure below shows the change in log perplexity relative to BF16 against composite benchmark quality.
Two regimes are visible. In the low-perplexity region, the quants remain near baseline, but perplexity does not rank them: similar-quality models can have noticeably different perplexity values. At higher perplexity, benchmark quality begins to fall more consistently. Even there, models with similar perplexity can differ by roughly two points of composite score.
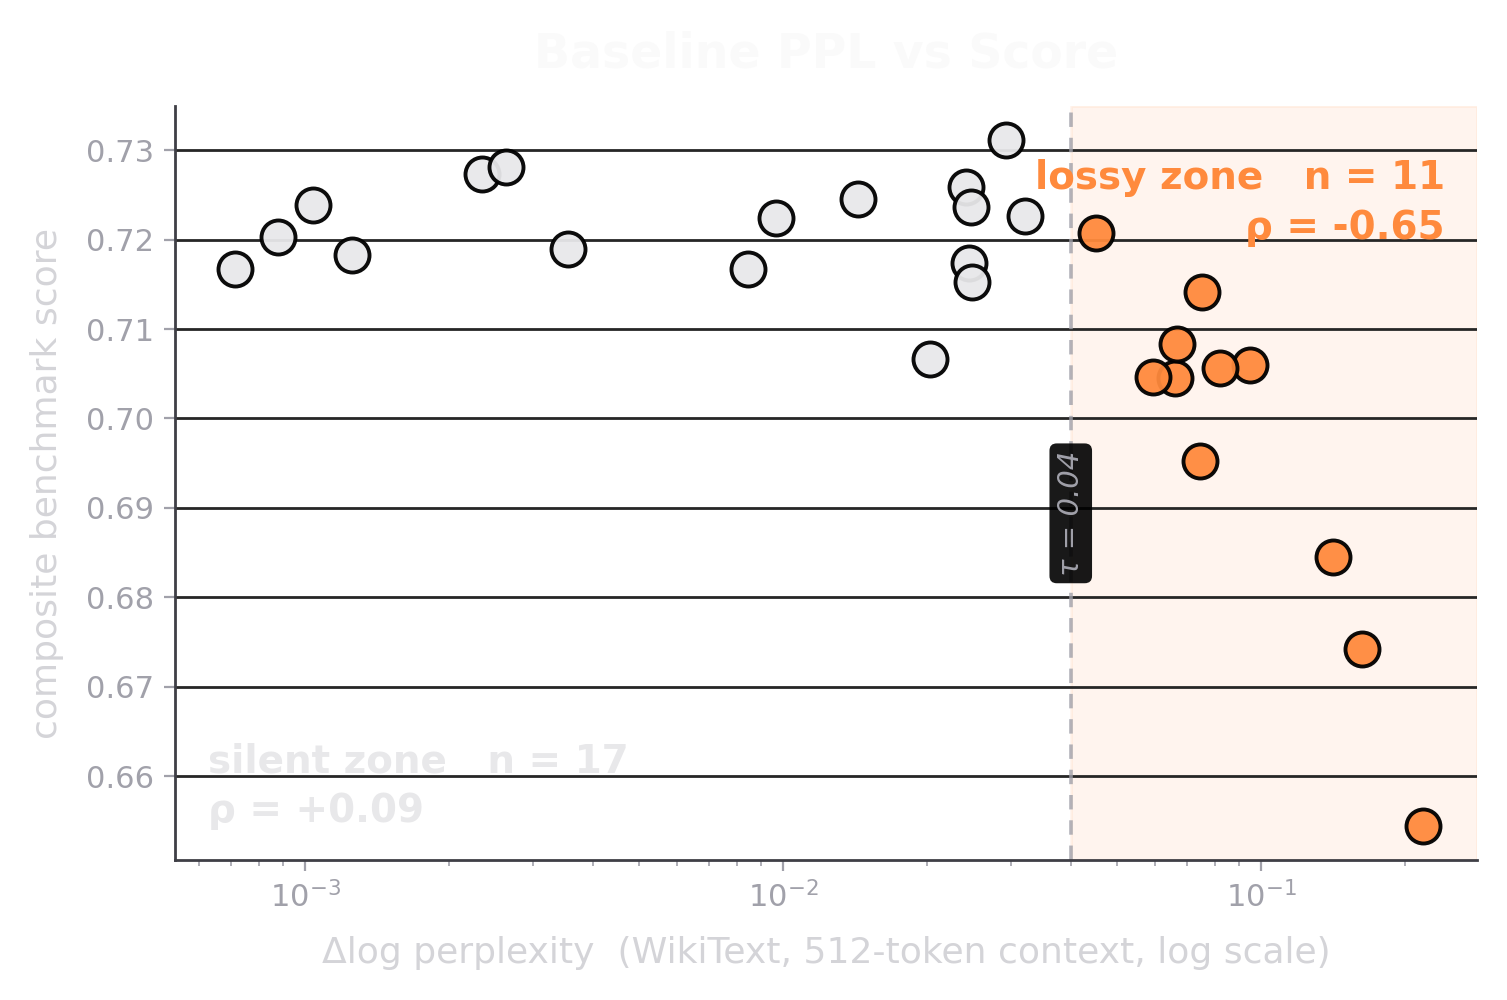
To summarize this pattern, we use an exploratory threshold of (\(\tau=0.040\)) and divide the cohort into two regions:
- a Silent zone, where the models remain near baseline and perplexity has little ranking value;
- a Lossy zone, where degradation is large enough for perplexity to become informative.
The threshold is descriptive rather than universal: it identifies the transition in this cohort and evaluation setup.
| region | n | Pearson(ΔlogPPL, quality) | Spearman |
|---|---|---|---|
| Lossy zone (ΔlogPPL > 0.040) | 11 | −0.95 | −0.65 |
| Silent zone (ΔlogPPL ≤ 0.040) | 17 | +0.02 | +0.09 |
| Full cohort | 28 | −0.92 | −0.68 |
Across the full cohort, perplexity appears strongly predictive: Pearson (\(r = -0.92\)) and Spearman (\(\rho = -0.68\)). But that relationship is driven by the lossy models. Inside the silent-zone, where the practical ranking problem is hardest, both correlations collapse to essentially zero.
This does not mean that every model in the lossy zone is unusable. Some may still offer a worthwhile size or speed trade-off. Perplexity can identify measurable degradation, but it cannot rank the near-baseline quants users are usually choosing between.
KL divergence
A natural response is that KLD should perform better than perplexity. Instead of scoring only the observed next token, KLD compares the quantized model’s full token distribution with the BF16 reference.
The figure below shows baseline KLD against composite benchmark quality. The same two-regime pattern appears. In the low-KLD region, the quants remain near baseline, but KLD does not rank them. Once KLD rises above roughly (0.064), quality begins to fall more consistently. Even in this lossy region, models with similar KLD can differ by roughly two points of composite score.
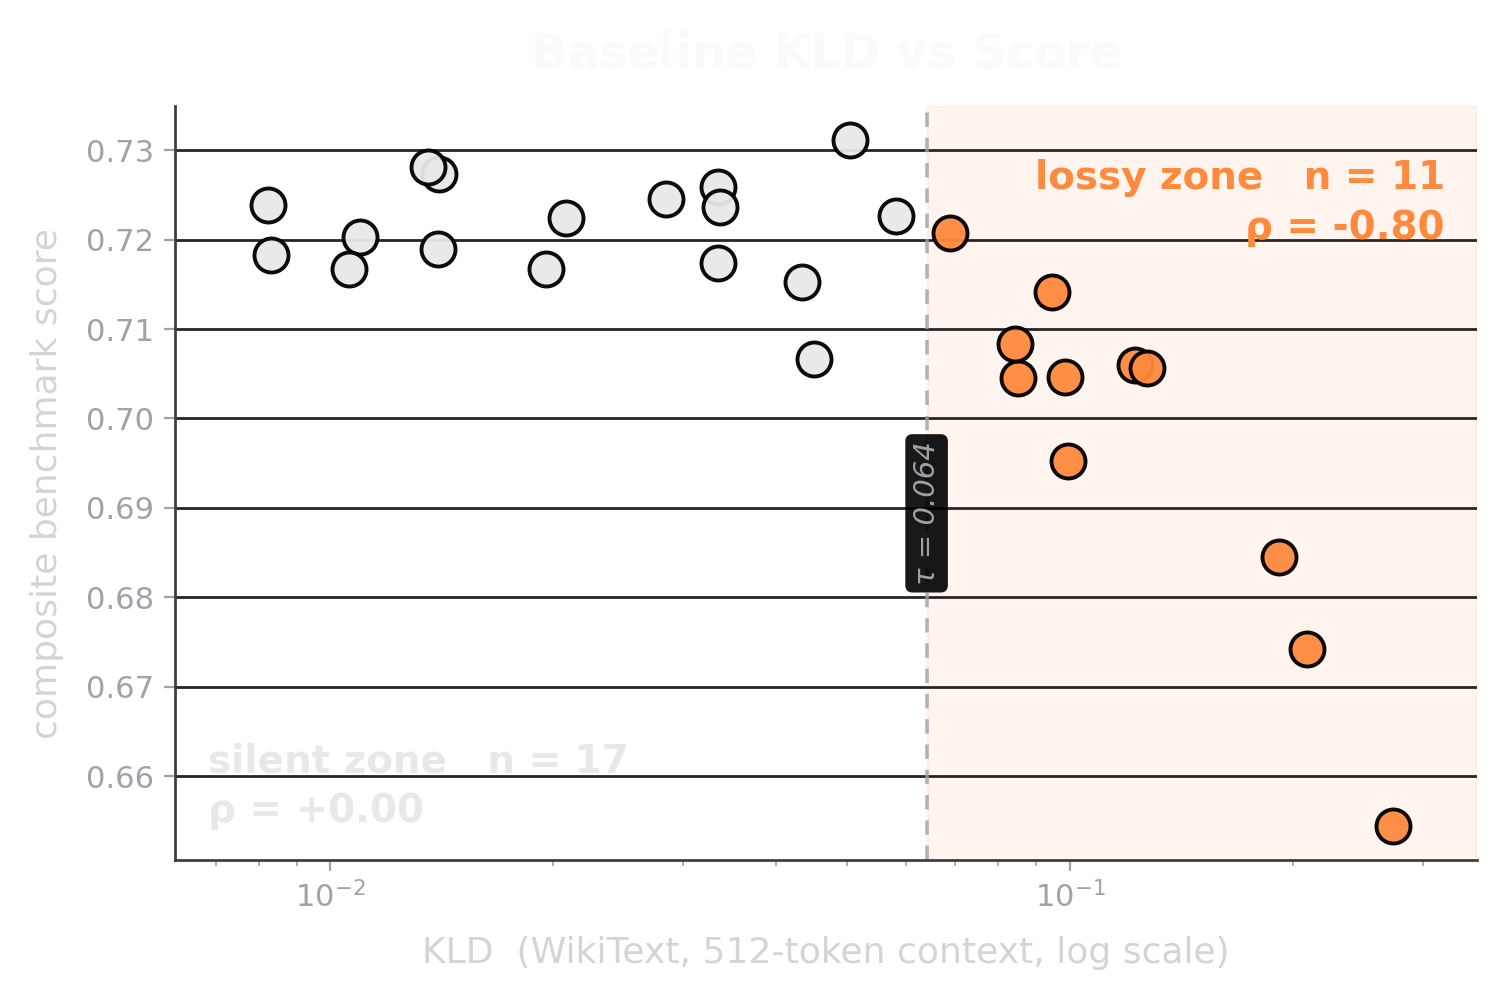
Using an exploratory threshold of (\(\tau=0.064\)), we divide the cohort into the same two descriptive regions:
| region | n | Pearson | Spearman |
|---|---|---|---|
| Lossy zone (KLD > 0.064) | 11 | −0.95 | −0.80 |
| Silent zone (KLD ≤ 0.064) | 17 | −0.06 | 0.00 |
| Full cohort | 28 | −0.92 | −0.72 |
KLD improves the lossy-zone Spearman correlation relative to perplexity: (−0.80) instead of (−0.65). But the practical conclusion is unchanged. Inside the silent zone, KLD still has no ranking signal: (\(\rho=0.00\)).
KLD is therefore a stronger diagnostic for clearly degraded models, but it still cannot choose among near-baseline quants. Its full cohort correlation becomes useful only after the cohort includes models whose benchmark degradation is already measurable.
Deployment-aligned KLD
The baseline setup may be too far removed from real use. WikiText-2 is not a deployment workload, 512-token chunks are short, prompt tokens are not generated behaviour, and full-distribution KLD includes low-probability tokens that are unlikely to affect decoding.
We therefore test a more deployment-aligned variant that:
- uses an internal validation set closer to deployment prompts,
- computes KLD only on response tokens,
- uses enough context to fit each full example,
- computes KLD over the top 60 tokens.
The figure below shows this variant against composite benchmark quality.
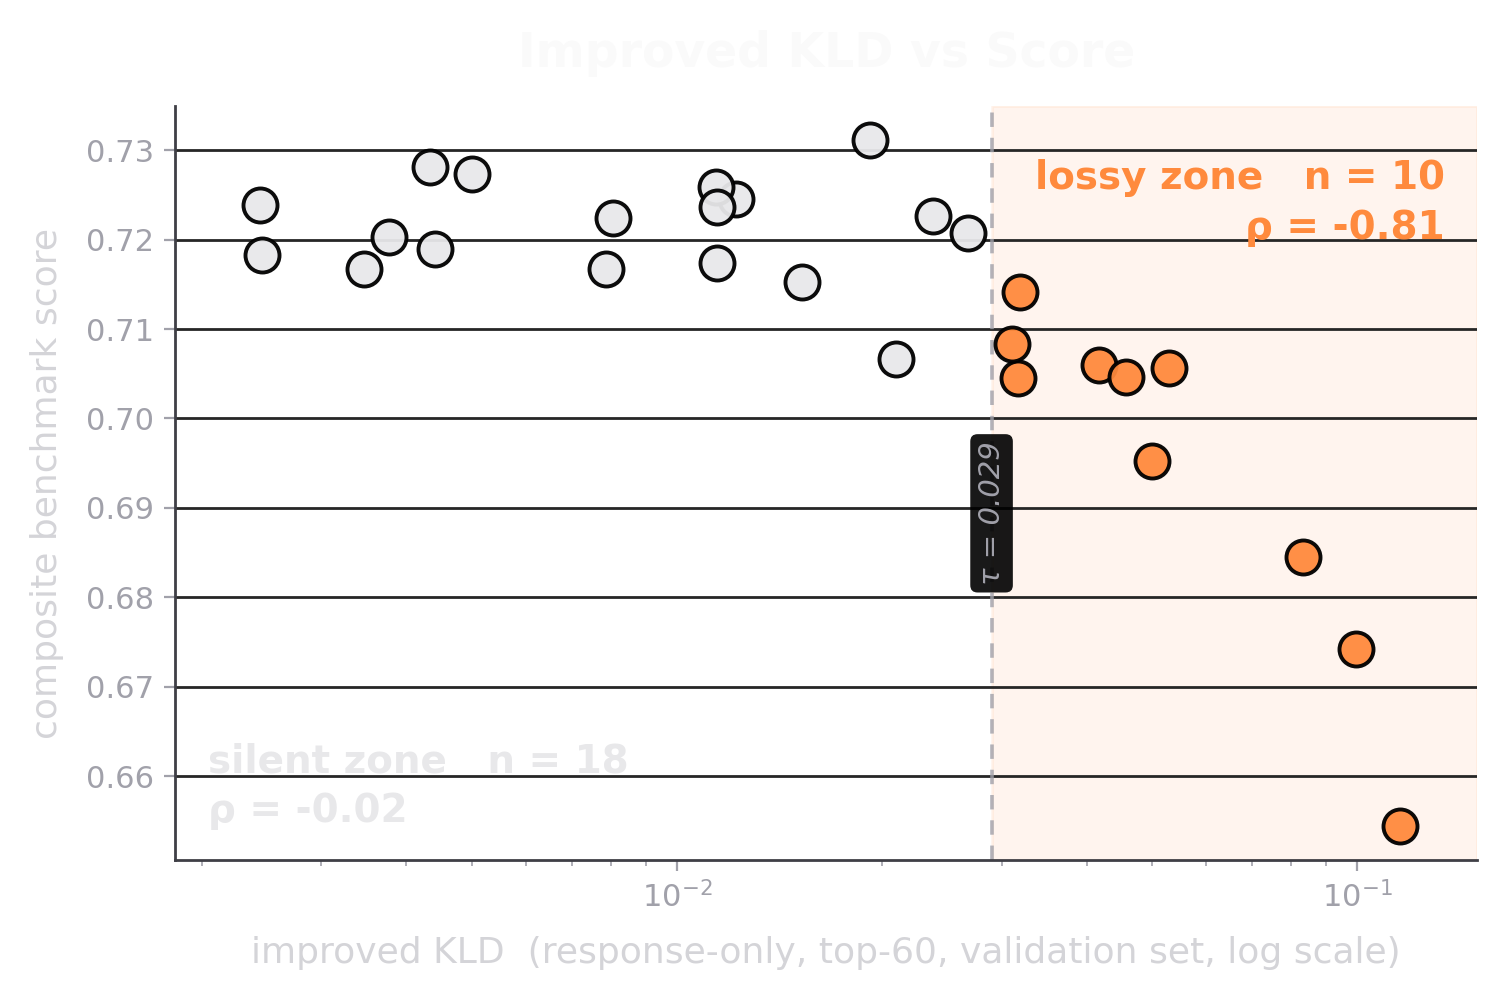
The result is cleaner: models with similar KLD differ by roughly one point of composite score rather than two. But the same two-regime pattern remains. In the low-KLD region, the quants remain near baseline and KLD still does not rank them. Quality begins to fall more consistently only above approximately (\(\tau=0.029\)).
| region | n | Pearson | Spearman |
|---|---|---|---|
| Lossy zone (KLD > 0.029) | 10 | −0.96 | −0.81 |
| Silent zone (KLD ≤ 0.029) | 18 | −0.12 | −0.02 |
| Full cohort | 28 | −0.94 | −0.73 |
This variant slightly strengthens the full cohort and lossy-zone correlations and reduces some of the spread. But it does not recover a ranking signal among near-baseline quants: inside the silent zone, Spearman correlation remains effectively zero at (\(\rho=-0.02\)).
A more deployment-aligned KLD is therefore a cleaner degradation diagnostic, not a solution to the model-selection problem.
Fourteen fidelity metrics, same silent zone
A final possibility is that the problem lies not with fidelity metrics themselves, but with the particular way we computed them.
We therefore tested 14 variants spanning:
- KLD and perplexity,
- mean, median, and tail aggregation,
- 512-token and 8k-token context,
- WikiText-2 and deployment-aligned validation data,
- prompt-plus-response and response-only scoring,
- full-distribution and top-k KLD,
- and top-1 token agreement.
To compare the variants fairly, we evaluate every metric on the same regions defined by the baseline KLD threshold (\(\tau=0.064\)): 17 near-baseline models in the silent-zone and 11 degraded models in the lossy zone.
| Fidelity metric | Full cohort (n=28) | Silent zone (n=17) | Lossy zone (n=11) |
|---|---|---|---|
| KLD mean, wiki ctx512 | −0.72 | +0.00 | −0.80 |
| KLD median, wiki ctx512 | −0.69 | +0.03 | −0.61 |
| KLD p90, wiki ctx512 | −0.71 | +0.01 | −0.76 |
| KLD p99 (tail), wiki ctx512 | −0.75 | −0.11 | −0.93 |
| mean Δlog-PPL, wiki ctx512 | −0.68 | +0.09 | −0.65 |
| PPL ratio (q/base), wiki ctx512 | −0.68 | +0.09 | −0.65 |
| PPL diff, wiki ctx512 | −0.68 | +0.09 | −0.65 |
| top-1 agreement %, wiki ctx512 | +0.70 | −0.04 | +0.68 |
| KLD mean, wiki ctx8k | −0.72 | +0.00 | −0.80 |
| PPL ratio, wiki ctx8k | −0.69 | +0.09 | −0.75 |
| top-1 agreement %, wiki ctx8k | +0.69 | −0.03 | +0.66 |
| KLD val-set, wiki-style ctx512 | −0.71 | +0.03 | −0.80 |
| KLD val-response, top-60 | −0.73 | −0.03 | −0.85 |
| KLD val-response, top-20 | −0.73 | −0.03 | −0.85 |
Across the full cohort, the metrics appear predictive: absolute Spearman correlations are typically between (0.68) and (0.75). They also remain useful in the lossy zone, where greater divergence generally accompanies lower benchmark quality.
Inside the silent zone, however, every metric remains close to zero, with (\(|\rho|\leq0.11\)).
Changing the aggregation rule does not recover the ranking. Neither does longer context, deployment-aligned data, response-only scoring, top-k KLD, or top-1 agreement.
The result is therefore not specific to one implementation of KLD or perplexity. Fidelity metrics can detect substantial degradation, but none of the tested variants reliably ranks near-baseline quants.
2 - Real case studies: when fidelity metrics and benchmark results disagree
The aggregate correlations tell us that PPL and KLD fail in the silent-zone. But correlations are abstract, so let’s look at concrete examples where the fidelity ranking and benchmark result disagree.
We start with two coding benchmarks: HumanEval and LiveCodeBench. Coding benchmarks are useful here because the outcome is hard to hand-wave away: the model writes code, the benchmark runs hidden tests, and each response either passes or fails.
2.1 - HumanEval: the lower-KLD model loses
HumanEval tests whether generated Python functions pass hidden unit tests. We compare two near-baseline quants:
- A: AesSedai-Q5_K_M, the lowest-KLD quant in the cohort;
- B: ByteShape IQ4_XS-4.15bpw, with roughly six times higher KLD.
| Model | KLD, WikiText-2 ctx512 | HumanEval score |
|---|---|---|
| A AesSedai-Q5_K_M | 0.008 | 0.945 |
| B ByteShape IQ4_XS-4.15bpw | 0.050 | 0.982 |
If lower KLD implied better downstream quality, A should be the safer choice. The benchmark shows the opposite.
Across HumanEval’s 164 problems:
- both models pass 155,
- both fail 3,
- B passes 6 that A fails,
- A passes 0 that B fails.
The disagreement is entirely one-sided.
1) sample_id=163 (generate_integers)
Prompt:
def generate_integers(a, b):
    """Given two positive integers a and b, return the even digits between a
    and b, in ascending order.
    For example:
    generate_integers(2, 8) => [2, 4, 6, 8]
    generate_integers(8, 2) => [2, 4, 6, 8]
    generate_integers(10, 14) => []
    """
The important phrase is “even digits.” The function should return members of {0, 2, 4, 6, 8} that fall within the specified range. The final example makes this explicit: although 10, 12, and 14 are even integers, none is a single digit.
A (AesSedai-Q5_K_M, FAILED):
def generate_integers(a, b):
    start = min(a, b)
    end = max(a, b)
    result = []
    for num in range(start, end + 1):
        if num % 2 == 0:
            result.append(num)
    return result
Model A read it as "even integers between a and b". For input (10, 14) it returns [10, 12, 14], the even integers in range. This is a direct contradiction of the description and docstring's third example.
B (ByteShape IQ4_XS-4.15bpw, PASSED):
def generate_integers(a, b):
    start = min(a, b)
    end = max(a, b)
    even_digits = [0, 2, 4, 6, 8]
    return [d for d in even_digits if start <= d <= end]
B follows the literal specification and returns only single-digit even values, instead of glossing over the requirements like model A did.
2) sample_id=132 (is_nested)
Prompt:
def is_nested(string):
    '''
    Create a function that takes a string as input which contains only square brackets.
    The function should return True if and only if there is a valid subsequence of brackets
    where at least one bracket in the subsequence is nested.

    is_nested('[[]]') ➞ True
    is_nested('[]]]]]]][[[[[]') ➞ False
    is_nested('[][]') ➞ False
    is_nested('[]') ➞ False
    is_nested('[[][]]') ➞ True
    is_nested('[[]][[') ➞ True
    '''
The key word is “subsequence.” The task is effectively asking whether the string contains [[]] as a subsequence: two opening brackets followed later by two closing brackets.
A (FAILED):
def is_nested(string):
    stack = []
    for char in string:
        if char == '[':
            stack.append(char)
        elif char == ']':
            if stack:
                stack.pop()
                if stack:
                    return True   # we matched a ']' while stack was still deep
    return False
A uses standard stack-based bracket matching and returns True whenever it closes one bracket while another remains open. That does not enforce the required [[]] subsequence.
For '[]]]]]]][[[[[]', the final closing bracket is matched while several opening brackets remain on the stack, so A returns True. But only one closing bracket occurs after the final cluster of opening brackets, so [[]] cannot be formed as a subsequence. The expected result is False.
B (PASSED):
def is_nested(string):
    n = len(string)
    # find first '['
    first_open = next((i for i in range(n) if string[i]=='['), -1)
    if first_open == -1: return False
    # find second '[' after that
    second_open = next((j for j in range(first_open+1, n) if string[j]=='['), -1)
    if second_open == -1: return False
    # find first ']' after second '['
    first_close = next((k for k in range(second_open+1, n) if string[k]==']'), -1)
    if first_close == -1: return False
    # find another ']' after that
    return any(string[l]==']' for l in range(first_close+1, n))
B searches for the required subsequence directly: two opening brackets followed by two closing brackets.
In both examples, A defaults to a familiar algorithmic interpretation, while B follows the benchmark’s specific wording.
Does a more relevant KLD corpus fix the ranking?
WikiText-2 may simply be the wrong dataset for code. We therefore recomputed KLD using coding data, function-calling data, and the responses to the exact HumanEval prompts.
| corpus | A KLD | B KLD | B vs A KLD |
|---|---|---|---|
| wiki ctx512 | 0.0083 | 0.0504 | 6.1× |
| ByteShape validation coding-only subset | 0.00158 | 0.01230 | 7.8× |
| ByteShape validation function-calling subset | 0.00082 | 0.00472 | 5.8× |
| HumanEval responses | 0.00033 | 0.00218 | 6.6× |
| HumanEval score | 0.945 | 0.982 | — |
The ranking does not change. Even when KLD is computed on the exact task responses, the better-scoring model remains much farther from BF16.
The BF16 reference clue
We next calculated response-level KLD for each HumanEval prompt. On all six prompts where B passes and A fails, A remains closer to BF16.
| sid | function | BF16 | A KLD | A vs median (pct %) | B KLD | B vs median (pct %) |
|---|---|---|---|---|---|---|
| 62 | derivative |
FAIL | 0.00044 | 1.1× (55%) | 0.00634 | 2.2× (80%) |
| 64 | vowels_count |
PASS | 0.00058 | 1.5× (63%) | 0.00408 | 1.4× (63%) |
| 101 | words_string |
FAIL | 0.00031 | 0.8× (44%) | 0.00590 | 2.0× (77%) |
| 116 | sort_array |
FAIL | 0.00147 | 3.7× (89%) | 0.01299 | 4.4× (96%) |
| 132 | is_nested |
FAIL | 0.00277 | 6.9× (98%) | 0.02848 | 9.8× (100%) |
| 163 | generate_integers |
FAIL | 0.00109 | 2.7× (79%) | 0.00419 | 1.4× (65%) |
BF16 fails five of the six prompts where B beats A. A is closer to BF16, but BF16 is wrong. KLD therefore rewards similarity to the reference model’s behaviour, including its mistakes.
The remaining prompt is also informative. BF16 and B pass vowels_count, while A fails, but A’s KLD is only at the 63rd percentile of its HumanEval distribution. Its failure does not produce an unusually large divergence signal.
For completeness, the three prompts failed by all three models also tend to have elevated KLD:
| ID | Function | A KLD | A vs median (pct %) | B KLD | B vs median (pct %) |
|---|---|---|---|---|---|
| 93 | encode |
0.00168 | 4.2× (94%) | 0.00971 | 3.3× (92%) |
| 134 | check_if_last_char_is_a_letter |
0.00176 | 4.4× (95%) | 0.00946 | 3.2× (91%) |
| 145 | order_by_points |
0.00160 | 4.0× (92%) | 0.01127 | 3.9× (95%) |
This suggests that per-prompt KLD may contain a weak signal about difficulty or instability. But elevated KLD is not specific to failure, and many incorrect responses do not produce an unusually large value. It is therefore not a reliable pass/fail predictor.
HumanEval therefore exposes two distinct limitations:
- KLD can reward similarity to incorrect BF16 behaviour.
- Within a model, per-prompt KLD does not reliably separate correct from incorrect responses.
2.2 - LiveCodeBench: Score, Volume and Direction
HumanEval compared one model pair on 164 problems. To test whether that result generalizes, we turn to LiveCodeBench: a larger and harder coding benchmark with 1,055 prompts.
We compare eight models from the KLD silent zone, labelled S1–S8, against a higher-KLD ByteShape model, labelled C. Model B from the HumanEval case study remains in the table as S8.
| Index | Model | BPW | KLD wiki ctx512 | LCB score | Notes |
|---|---|---|---|---|---|
| S1 | unsloth-UD-Q5_K_XL | 6.14 | 0.0082 | 0.663 | cleanest-KLD |
| S2 | AesSedai-Q5_K_M | 6.06 | 0.0083 | 0.673 | A from HumanEval |
| S3 | mudler-APEX-Balanced | 5.91 | 0.0106 | 0.660 | |
| S4 | unsloth-UD-Q4_K_XL | 5.16 | 0.0136 | 0.674 | |
| S5 | mudler-APEX-Quality | 5.26 | 0.0140 | 0.677 | |
| S6 | bartowski-Q4_K_L | 5.02 | 0.0196 | 0.659 | |
| S7 | unsloth-UD-IQ4_XS | 4.09 | 0.0336 | 0.679 | highest LCB of any silent-zone model |
| S8 | ByteShape IQ4_XS-4.15bpw | 4.15 | 0.0504 | 0.672 | B from HumanEval |
| C | ByteShape IQ4_XS-3.93bpw | 3.93 | 0.0689 | 0.682 | Outside the silent zone, yet the best on LCB |
Model-level ranking failure
Model C has the highest KLD in the comparison and sits just above the silent-zone threshold. Nevertheless, it achieves the highest LiveCodeBench score.
The result becomes clearer when we compare C head-to-head with each silent-zone model and count prompts where exactly one model passes:
| Index | Opponent | KLD ratio (C/S) | S score | S-only | C-only | Net |
|---|---|---|---|---|---|---|
| S7 | unsloth-UD-IQ4_XS | 2.0× | 0.679 | 88 | 92 | C +4 |
| S5 | mudler-APEX-Quality | 4.9× | 0.677 | 90 | 96 | C +6 |
| S4 | unsloth-UD-Q4_K_XL | 5.1× | 0.674 | 87 | 96 | C +9 |
| S2 | AesSedai-Q5_K_M | 8.3× | 0.673 | 90 | 100 | C +10 |
| S8 | B (IQ4_XS-4.15bpw) | 1.4× | 0.672 | 87 | 98 | C +11 |
| S1 | unsloth-UD-Q5_K_XL | 8.4× | 0.663 | 78 | 99 | C +21 |
| S3 | mudler-APEX-Balanced | 6.5× | 0.660 | 73 | 97 | C +24 |
| S6 | bartowski-Q4_K_L | 3.5× | 0.659 | 69 | 94 | C +25 |
C wins every pairing, despite having between 1.4 and 8.4 times the KLD of its opponents.
KLD also fails to rank the silent-zone models among themselves. Across S1–S8, Spearman correlation between KLD and LiveCodeBench score is (+0.24) (\(p=0.57\)): weak, statistically insignificant, and in the opposite direction from the expected relationship. Across the full 17-model silent zone, the correlation falls to (+0.08).
The model-level result therefore matches the aggregate analysis: among near-baseline quants, lower KLD does not reliably imply higher benchmark quality.
Per-prompt KLD by each model's own outcome
Next, we compute KLD on the responses to individual LiveCodeBench prompts and compare each model’s passed and failed responses.
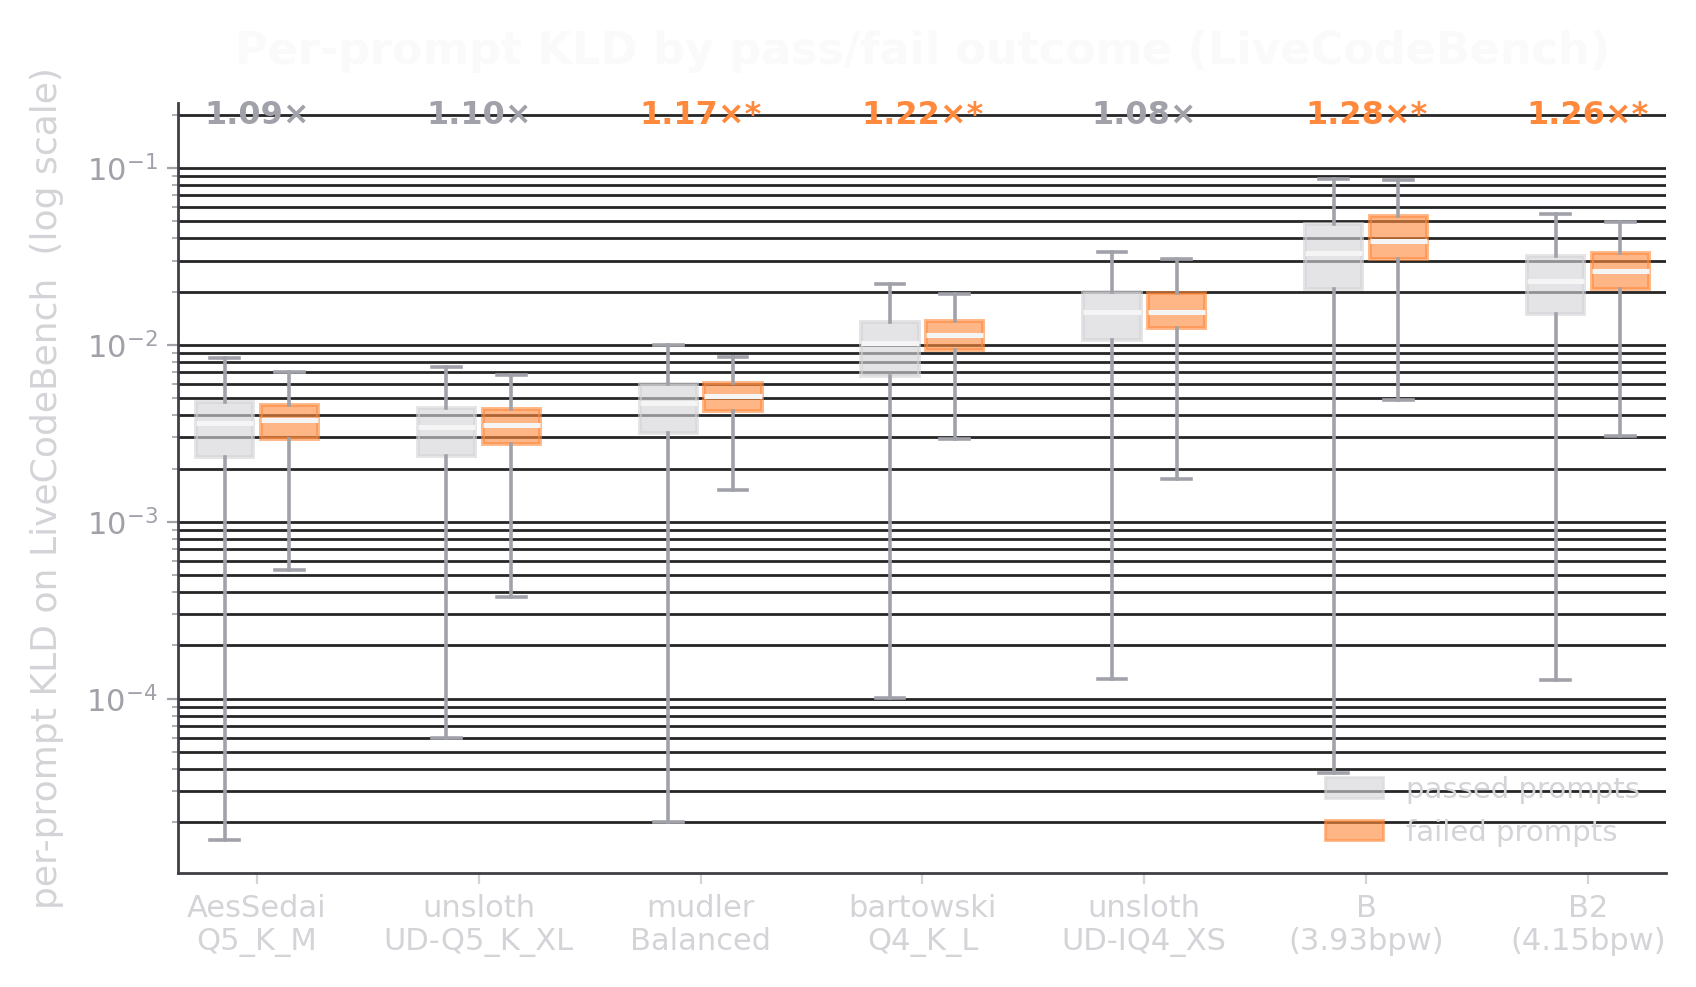
Failed prompts have slightly higher geometric-mean KLD than passed prompts, but the effect is tiny. The fail/pass ratios range from 1.08 to 1.28, and the difference is statistically detectable for four of the seven tested models using a Mann–Whitney U test.
This suggests that failures are associated with somewhat greater divergence. But the distributions overlap too heavily for the signal to be practically useful. An 8–28% average difference does not reliably identify whether a particular response is correct.
Per-prompt KLD is therefore a detectable failure correlate, not a usable pass/fail predictor.
Routing to the lower-KLD model fails
A weaker possibility is that per-prompt KLD could still help choose between two models. Given a prompt and two quants, we could route the prompt to whichever model has lower KLD.
We test this by pairing C with five comparison models and examining only disagreement prompts, where exactly one model passes:
| Pairing | Disagreement prompts | Lower-KLD model wins | ρ(KLD, correctness) | p |
|---|---|---|---|---|
| C vs AesSedai-Q5_K_M | 190 | 47.4% | +0.033 | 0.53 |
| C vs unsloth-UD-Q5_K_XL | 177 | 44.1% | +0.109 | 0.040 |
| C vs mudler-APEX-Balanced | 170 | 42.9% | +0.126 | 0.020 |
| C vs bartowski-Q4_K_L | 163 | 42.3% | +0.128 | 0.020 |
| C vs unsloth-UD-IQ4_XS | 180 | 49.4% | −0.009 | 0.86 |
Routing to the lower-KLD model succeeds on only 42.3–49.4% of the disagreement prompts. None of the five pairings reaches 50%.
In the three statistically significant comparisons, the relationship points in the wrong direction: the higher-KLD model is more likely to be correct. On prompts that BF16 itself fails, routing to the lower-KLD model succeeds only 40.8% of the time.
Per-prompt KLD therefore cannot reliably route prompts between otherwise capable quants. Staying closer to BF16 also means staying closer to BF16’s mistakes.
KLD measures volume, not direction
If KLD does not predict score, what does it measure?
For every quant, we compare its 1,055 LiveCodeBench outcomes with BF16 and divide disagreements into:
- leapfrogs: the quant passes where BF16 fails;
- drops: the quant fails where BF16 passes.
Their sum is the total volume of changed outcomes. Their balance determines whether those changes improve or reduce the score.
| Index | Model | KLD, WikiText-2 ctx512 | LCB | Leapfrogs BF16 | Drops | Total flips | Net vs BF16 | % of BF16 fails recovered |
|---|---|---|---|---|---|---|---|---|
| S1 | unsloth-UD-Q5_K_XL | 0.0082 | 0.663 | 67 | 107 | 174 | −40 | 21.2% |
| S2 | AesSedai-Q5_K_M | 0.0083 | 0.673 | 70 | 99 | 169 | −29 | 22.2% |
| S3 | mudler-APEX-Balanced | 0.0106 | 0.660 | 77 | 120 | 197 | −43 | 24.4% |
| S4 | unsloth-UD-Q4_K_XL | 0.0136 | 0.674 | 76 | 104 | 180 | −28 | 24.1% |
| S5 | mudler-APEX-Quality | 0.0140 | 0.677 | 72 | 97 | 169 | −25 | 22.8% |
| S6 | bartowski-Q4_K_L | 0.0196 | 0.659 | 67 | 111 | 178 | −44 | 21.2% |
| S7 | unsloth-UD-IQ4_XS | 0.0336 | 0.679 | 78 | 101 | 179 | −23 | 24.7% |
| S8 | ByteShape IQ4_XS-4.15bpw | 0.0504 | 0.672 | 84 | 114 | 198 | −30 | 26.6% |
| C | ByteShape IQ4_XS-3.93bpw | 0.0689 | 0.682 | 83 | 102 | 185 | −19 | 26.3% |
The two highest-KLD models, S8 and C, recover the largest number of BF16 failures: 84 and 83 leapfrogs. But they also introduce many drops. C achieves the best score because it combines a high number of leapfrogs with fewer drops than the other high-disagreement models.
The distinction becomes clear in the correlations:
| KLD correlates with… | Silent zone (n=17) | Full cohort (n=28) |
|---|---|---|
| LCB score | +0.08 (n.s.) | −0.65 (p<0.001) |
| Leapfrogs | +0.45 (p=0.07) | −0.20 (n.s.) |
| Drops | +0.29 (n.s.) | +0.75 (p<0.001) |
| Total disagreements | +0.50 (p=0.04) | +0.82 (p<0.001) |
The stable relationship is between KLD and the number of changed outcomes. KLD tracks total disagreements with BF16 in both the silent-zone and the full cohort.
Benchmark score, however, depends on whether those disagreements are helpful or harmful. Let (f) be the fraction of changed outcomes that are leapfrogs. Then:
\[\mathrm{score} = \mathrm{BF16\ score} + \frac{\mathrm{total}\,(2f-1)}{1055}\]
This separates the result into:
- volume: how many outcomes change;
- direction: what fraction of those changes are improvements.
| term | ρ with KLD, silent (n=17) | ρ with KLD, full (n=28) |
|---|---|---|
| volume (total flips) | +0.50 (p=0.04) | +0.82 (p<0.001) |
| direction (leapfrog fraction f) | +0.22 (n.s.) | −0.59 (p=0.001) |
KLD tracks volume in both regions. Its apparent relationship with direction comes from the heavily degraded models in the full cohort. Inside the silent zone, greater divergence does not tell us whether the changed outcomes are more or less useful.
Controlling for disagreement volume leaves no significant relationship between KLD and score:
\[r(\mathrm{KLD},\mathrm{score}\mid\mathrm{volume}) = -0.28,\qquad p=0.15\]
KLD measures displacement. Benchmark score depends on the direction of that displacement.
That is why KLD can identify heavily degraded models while failing to rank near-baseline ones.
2.3 - GSM8K-V: where KLD partially works
The first two case studies show lower-KLD models losing on coding benchmarks. To avoid selecting only examples that support our argument, we now examine the benchmark where KLD performs best.
GSM8K-V contains 1,319 grade-school math problems converted into visual prompts. BF16 passes 47.2%, leaving enough room for the quants to separate. We evaluate all 28 Qwen3.6-35B-A3B quants, including the 17-model silent-zone defined by baseline KLD (\(\leq 0.064\)).
KLD retains some signal on unsaturated math
Unlike the coding benchmarks, KLD keeps the expected negative relationship with quality on GSM8K-V.
| Benchmark | Silent zone Spearman ρ(KLD, score) | Full cohort Spearman | Silent score spread |
|---|---|---|---|
| GSM8K-V | −0.43 (p=0.09) | −0.83* | 0.027 |
| GSM8K-V thinking | −0.51* (p=0.04) | −0.83* | 0.036 |
| LiveCodeBench | +0.08 (n.s.) | −0.65* | 0.046 |
| HumanEval | +0.20 (n.s.) | −0.19 | 0.043 |
| GSM8K | +0.11 (n.s.) | −0.43* | 0.007 — saturated |
On LiveCodeBench and HumanEval, the silent-zone relationship is weak and points in the wrong direction. On GSM8K-V, it remains negative, and the thinking variant reaches statistical significance.
This is the strongest case for KLD in our results: even among near-baseline quants, greater divergence is associated with lower math performance.
The difference is direction, not volume
The LiveCodeBench analysis separated disagreements with BF16 into:
- volume: how many benchmark outcomes change;
- direction: what fraction of those changes improve on BF16.
Running the same analysis on GSM8K-V gives
| Silent zone ρ(KLD, …) | LiveCodeBench | GSM8K-V |
|---|---|---|
| Volume (total flips) | +0.50 (p=0.04) | +0.62 (p=0.007) |
| Direction (leapfrog fraction f) | +0.22 (n.s.) | −0.35 (p=0.17) |
| Score | +0.08 (n.s.) | −0.43 (p=0.09) |
KLD tracks disagreement volume on both benchmarks. The difference is what happens to the direction of those disagreements.
On LiveCodeBench, larger divergence changes more outcomes, but it does not consistently change them for better or worse. On GSM8K-V, larger divergence is also associated with a smaller fraction of productive changes. The directional relationship is not statistically significant by itself, but it is strong enough to give KLD the expected negative correlation with score.
A plausible interpretation is that math reasoning is more sensitive to accumulated local errors. A small change in an arithmetic or algebraic step can propagate through the remainder of the solution. Code correctness is more structurally flexible: many token-level-different programs can implement the same specification and pass the same tests.
This interpretation is consistent with the observed difference, although the current analysis does not prove that task structure is the cause.
Same KLD value, opposite verdict, along the math/code line
Model C provides a direct comparison. It has the same baseline KLD regardless of which benchmark we evaluate, but its relative performance changes sharply:
| LiveCodeBench | GSM8K-V | |
|---|---|---|
| C score | 0.682 (best in cohort) | 0.448 (worst among the compared models) |
| Leapfrogs | 83 | 74 |
| Drops | 102 | 106 |
| Leapfrog fraction (f) | 0.448 | 0.411 |
| KLD's prediction | Wrong | Correct |
On LiveCodeBench, C’s divergence produces enough productive alternatives to achieve the highest score. On GSM8K-V, the same level of divergence is associated with a less favorable balance of improvements and regressions.
KLD measures the displacement in both cases. The task determines whether that displacement is mostly productive or harmful.
The positive result still has limits
Two caveats prevent this result from turning KLD into a reliable ranking metric.
- The benchmark must have enough resolution. Plain GSM8K is nearly saturated: silent-zone scores span only 0.7 percentage points. With so little variation to rank, the silent-zone correlation becomes weak and wrong-signed at (+0.11).
- The correct direction does not guarantee a reliable ordering. On GSM8K-V thinking, KLD achieves only 69% pairwise concordance within the silent zone. The lower-KLD quant is better roughly two times out of three, leaving a substantial chance that the ranking is reversed.
KLD is therefore not universally uninformative. On unsaturated math benchmarks, it can retain a useful directional signal. But even in its strongest case, it does not rank near-baseline quants reliably enough to replace the benchmark.
3 - Conclusion: displacement is not direction
The three case studies reveal the same underlying mechanism.
HumanEval shows that lower KLD can reward similarity to incorrect BF16 behaviour. LiveCodeBench shows that KLD tracks how many outcomes change, but not whether those changes help or hurt. GSM8K-V shows the important exception: KLD can retain some directional signal when larger divergence is consistently associated with worse task performance.
We can summarize that mechanism across benchmarks by correlating KLD with:
- volume: the total number of outcome changes relative to BF16;
- direction: the fraction of those changes that improve on BF16.
| Benchmark | Silent volume | Lossy volume | Full volume | Silent f | Lossy f | Full f |
|---|---|---|---|---|---|---|
| HumanEval | +0.51* | +0.59† | +0.76* | +0.02 | −0.82* | −0.31 |
| LiveCodeBench | +0.50* | +0.81* | +0.82* | +0.22 | −0.93* | −0.59* |
| IFEval | +0.42† | +0.59† | +0.67* | +0.17 | −0.08 | −0.18 |
| BFCL-v3 | +0.91* | +0.83* | +0.96* | −0.14 | +0.12 | +0.44* |
| GSM8K (saturated) | +0.38 | +0.66* | +0.59* | +0.04 | −0.64* | −0.48* |
| GSM8K-V | +0.62* | +0.91* | +0.88* | −0.35 | −0.52 | −0.81* |
| GSM8K-V thinking | +0.66* | +0.75* | +0.84* | −0.52* | −0.87* | −0.83* |
| MMLU | +0.66* | +0.52† | +0.72* | −0.27 | +0.36 | +0.37† |
| composite (ex-MMLU) | +0.94* | +0.90* | +0.97* | −0.13 | −0.67* | −0.70* |
(* p < 0.05, † p < 0.10.)
The volume result is remarkably consistent. Inside the silent-zone, KLD correlates positively with disagreement volume across every benchmark, reaching (+0.94) for the composite. Higher KLD reliably means that a quant changes more outcomes relative to BF16.
Direction is much less consistent. In the lossy zone, larger displacement is usually associated with a greater fraction of harmful changes. Among near-baseline quants, that relationship disappears on code and instruction-following tasks and only partly survives on math.
The composite result captures the distinction clearly. Across the 17 near-baseline quants, KLD correlates (+0.94) with disagreement volume but (0.00) with composite quality. Across the full cohort, the quality correlation reaches (−0.72), largely because the lossy models both diverge farther and direct more of those changes toward incorrect outcomes.
KLD therefore measures how much a quantized model moves away from BF16. Benchmark quality depends primarily on the direction of that movement.
This explains why KLD is useful for detecting substantial degradation but unreliable for ranking deployable quants. It becomes predictive when larger displacement is consistently harmful. When changes can be helpful, harmful, or irrelevant, the ranking signal disappears.
The same qualitative pattern appears in our Devstral cohort despite its different architecture and quantization set. We focus on Qwen here because its prompt-level results make the mechanism easier to see. The full paper includes the Devstral replication, additional fidelity metrics, alternative thresholds, and robustness analyses: Displacement Is Not Direction: Evaluating Fidelity Metrics for Quantized LLM Deployment.
The practical conclusion is straightforward:
Use fidelity metrics to detect substantial degradation. Use downstream benchmarks to rank near-baseline quants.
KLD cannot replace the benchmark. Its quality correlation is zero or wrong-signed on several code and instruction-following tasks, while even its strongest math result reaches only 65–69% pairwise concordance.
The same warning applies to speed. KLD is the tempting one-number proxy for quality; BPW is the tempting one-number proxy for throughput. Part 3 asks when BPW predicts real token-generation rate and when hardware, kernels, and quantization format break that ranking.