
Beyond a Single Number:
Evaluating Quantized Models for Deployment
Quantized models are often compared using a single convenient number: model size, bits per weight, perplexity, KL divergence, or tokens per second.
Each of these metrics answers a useful question. None answers the full deployment question:
Which quant should I run on my hardware?
This three-part series develops ByteShape’s practical approach to quantized-model evaluation. The framework is simple:
- Does the model fit?
- How well does it perform?
- How fast does it run on the target hardware?
Fit determines which models are possible. Downstream quality and measured throughput determine which of those models are practical.
Part 1: Fit, Quality, and Speed: A Practical Framework for Choosing Quants
Why fit, downstream quality, and throughput matter more than any single proxy.
Part 1 introduces the evaluation framework. It separates three categories of measurement:
- fit metrics, such as model size, BPW, and context-memory requirements;
- quality measurements, such as downstream task benchmarks;
- deployment measurements, such as token-generation throughput on the target hardware.
It also distinguishes downstream quality from fidelity to a reference model. Perplexity and KL divergence are useful for detecting substantial degradation, but they do not directly measure whether a quant answers correctly, follows instructions, or writes working code.
Part 2: Displacement Is Not Direction: Why Fidelity Metrics Fail to Rank Near-Baseline Quants
Testing perplexity, KLD, and related diagnostics on real quantized models.
Part 2 moves from intuition to evidence.
Across the full model cohort, perplexity and KLD appear to predict benchmark quality. But that relationship is largely driven by clearly degraded quants. Among models that remain close to baseline quality, the ranking signal collapses.
We test 14 fidelity-metric variants across different datasets, context lengths, aggregation methods, and response-only scoring setups. The result remains consistent: fidelity metrics can detect large departures from BF16, but they do not reliably rank near-baseline quants.
At the prompt level, KLD tells us how often a quant differs from BF16. It does not tell us whether those differences help, hurt, or leave the outcome unchanged.
KLD measures displacement. Benchmark quality depends on the direction of that displacement.
Part 3: Size Is Not Speed: Why BPW Fails to Rank Similar-Sized Quants
Why model size and bits per weight do not reliably rank similar-sized quants.
Part 3 examines the deployment side of the problem.
Model size and bits per weight are useful for determining whether a quant fits and for estimating broad performance trends. But among similarly sized models, BPW does not reliably predict measured token-generation speed.
Actual throughput also depends on:
- quantization format,
- tensor shapes and group sizes,
- kernel support,
- memory-access behaviour,
- CPU and GPU architecture,
- workload and context length,
- and inference-engine implementation.
A smaller quant may be slower than a larger one. A format that performs well on one GPU may rank differently on another device.
BPW measures storage cost. It does not directly measure realized speed.
Proxy rank is not deployment rank
Parts 2 and 3 reveal the same underlying problem.
KLD is a proxy for retained fidelity to the BF16 reference. BPW is a proxy for model size and, indirectly, expected speed. Both are useful screening metrics. Neither directly measures the final deployment outcome.
The figure below compares where each quant is placed by those proxies with where it lands using measured deployment results on the RTX 6000.
Each quant appears twice:
- a hollow circle marks its proxy-ranked position, where lower KLD implies better quality and lower BPW implies greater speed;
- an arrowhead marks its measured position, where downstream benchmark score determines quality rank and measured token-generation throughput determines speed rank.
An arrow connects the two positions.
If the proxies reproduced the deployment ranking, the hollow circle and arrowhead would overlap. Instead, many arrows are long, and their directions vary substantially.
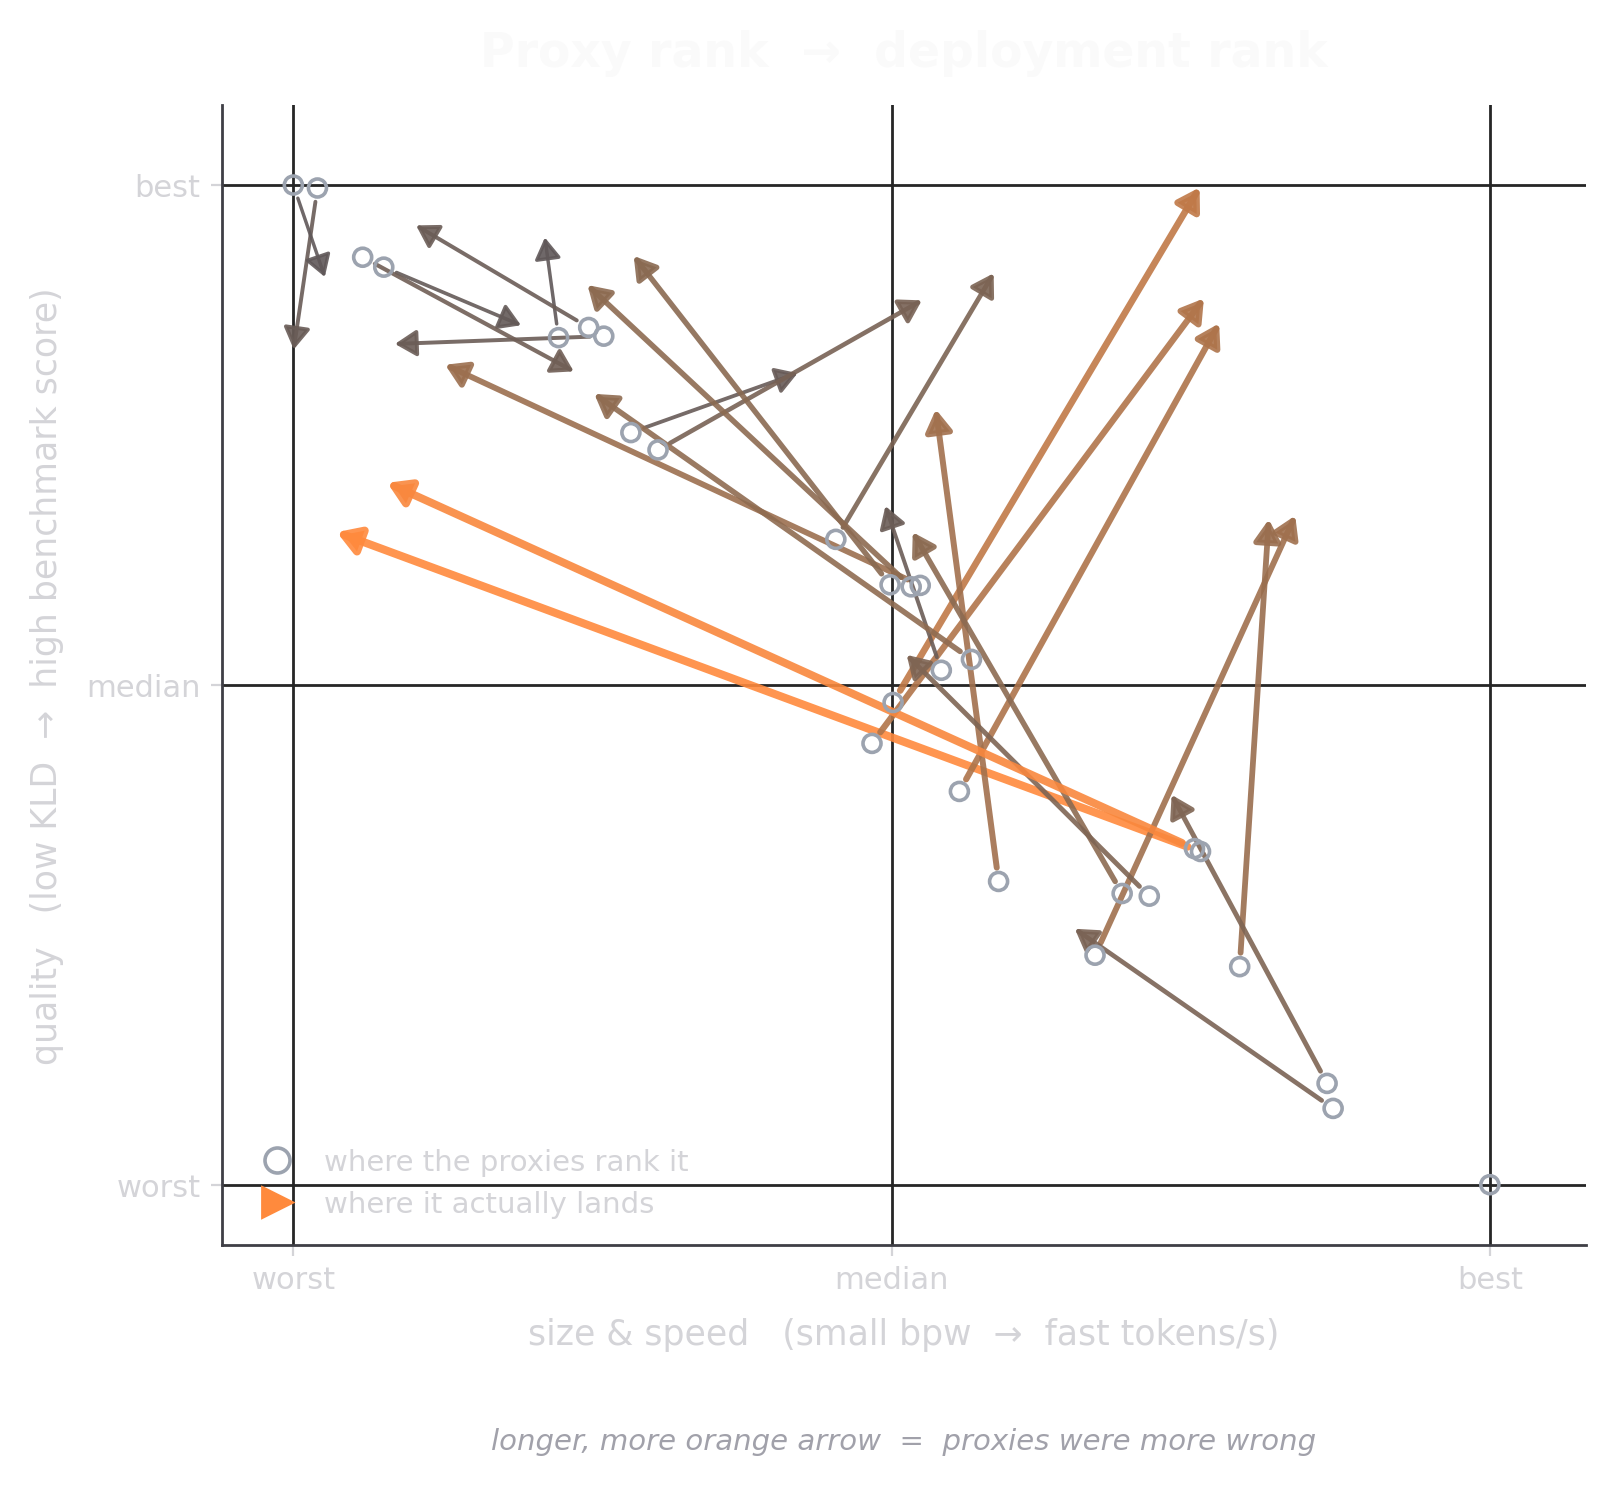
Vertical movement represents disagreement between KLD and benchmark-quality.
Horizontal movement represents disagreement between BPW and measured-throughput.
The total displacement combines both ranking errors.
Some quants move vertically because their benchmark-quality rank differs from their KLD-based proxy rank. Others move horizontally because their quantization format runs faster or slower than BPW predicts. Some move substantially on both axes.
The exact throughput ranking is hardware-specific. The figure uses RTX 6000 measurements, but the broader conclusion is general:
The quant that wins the proxies is often not the quant that wins in deployment.
The practical takeaway
A practical quant-selection process has three steps:
- Filter by fit. Eliminate models that exceed the available memory at the required context length.
- Compare downstream quality. Benchmark the remaining models on tasks that reflect the intended workload.
- Measure throughput. Test the actual inference engine, hardware, context length, and generation settings.
The best choice is the quant that fits, performs well, and runs fast enough for the intended workload.